Data study
Happier than the numbers say?
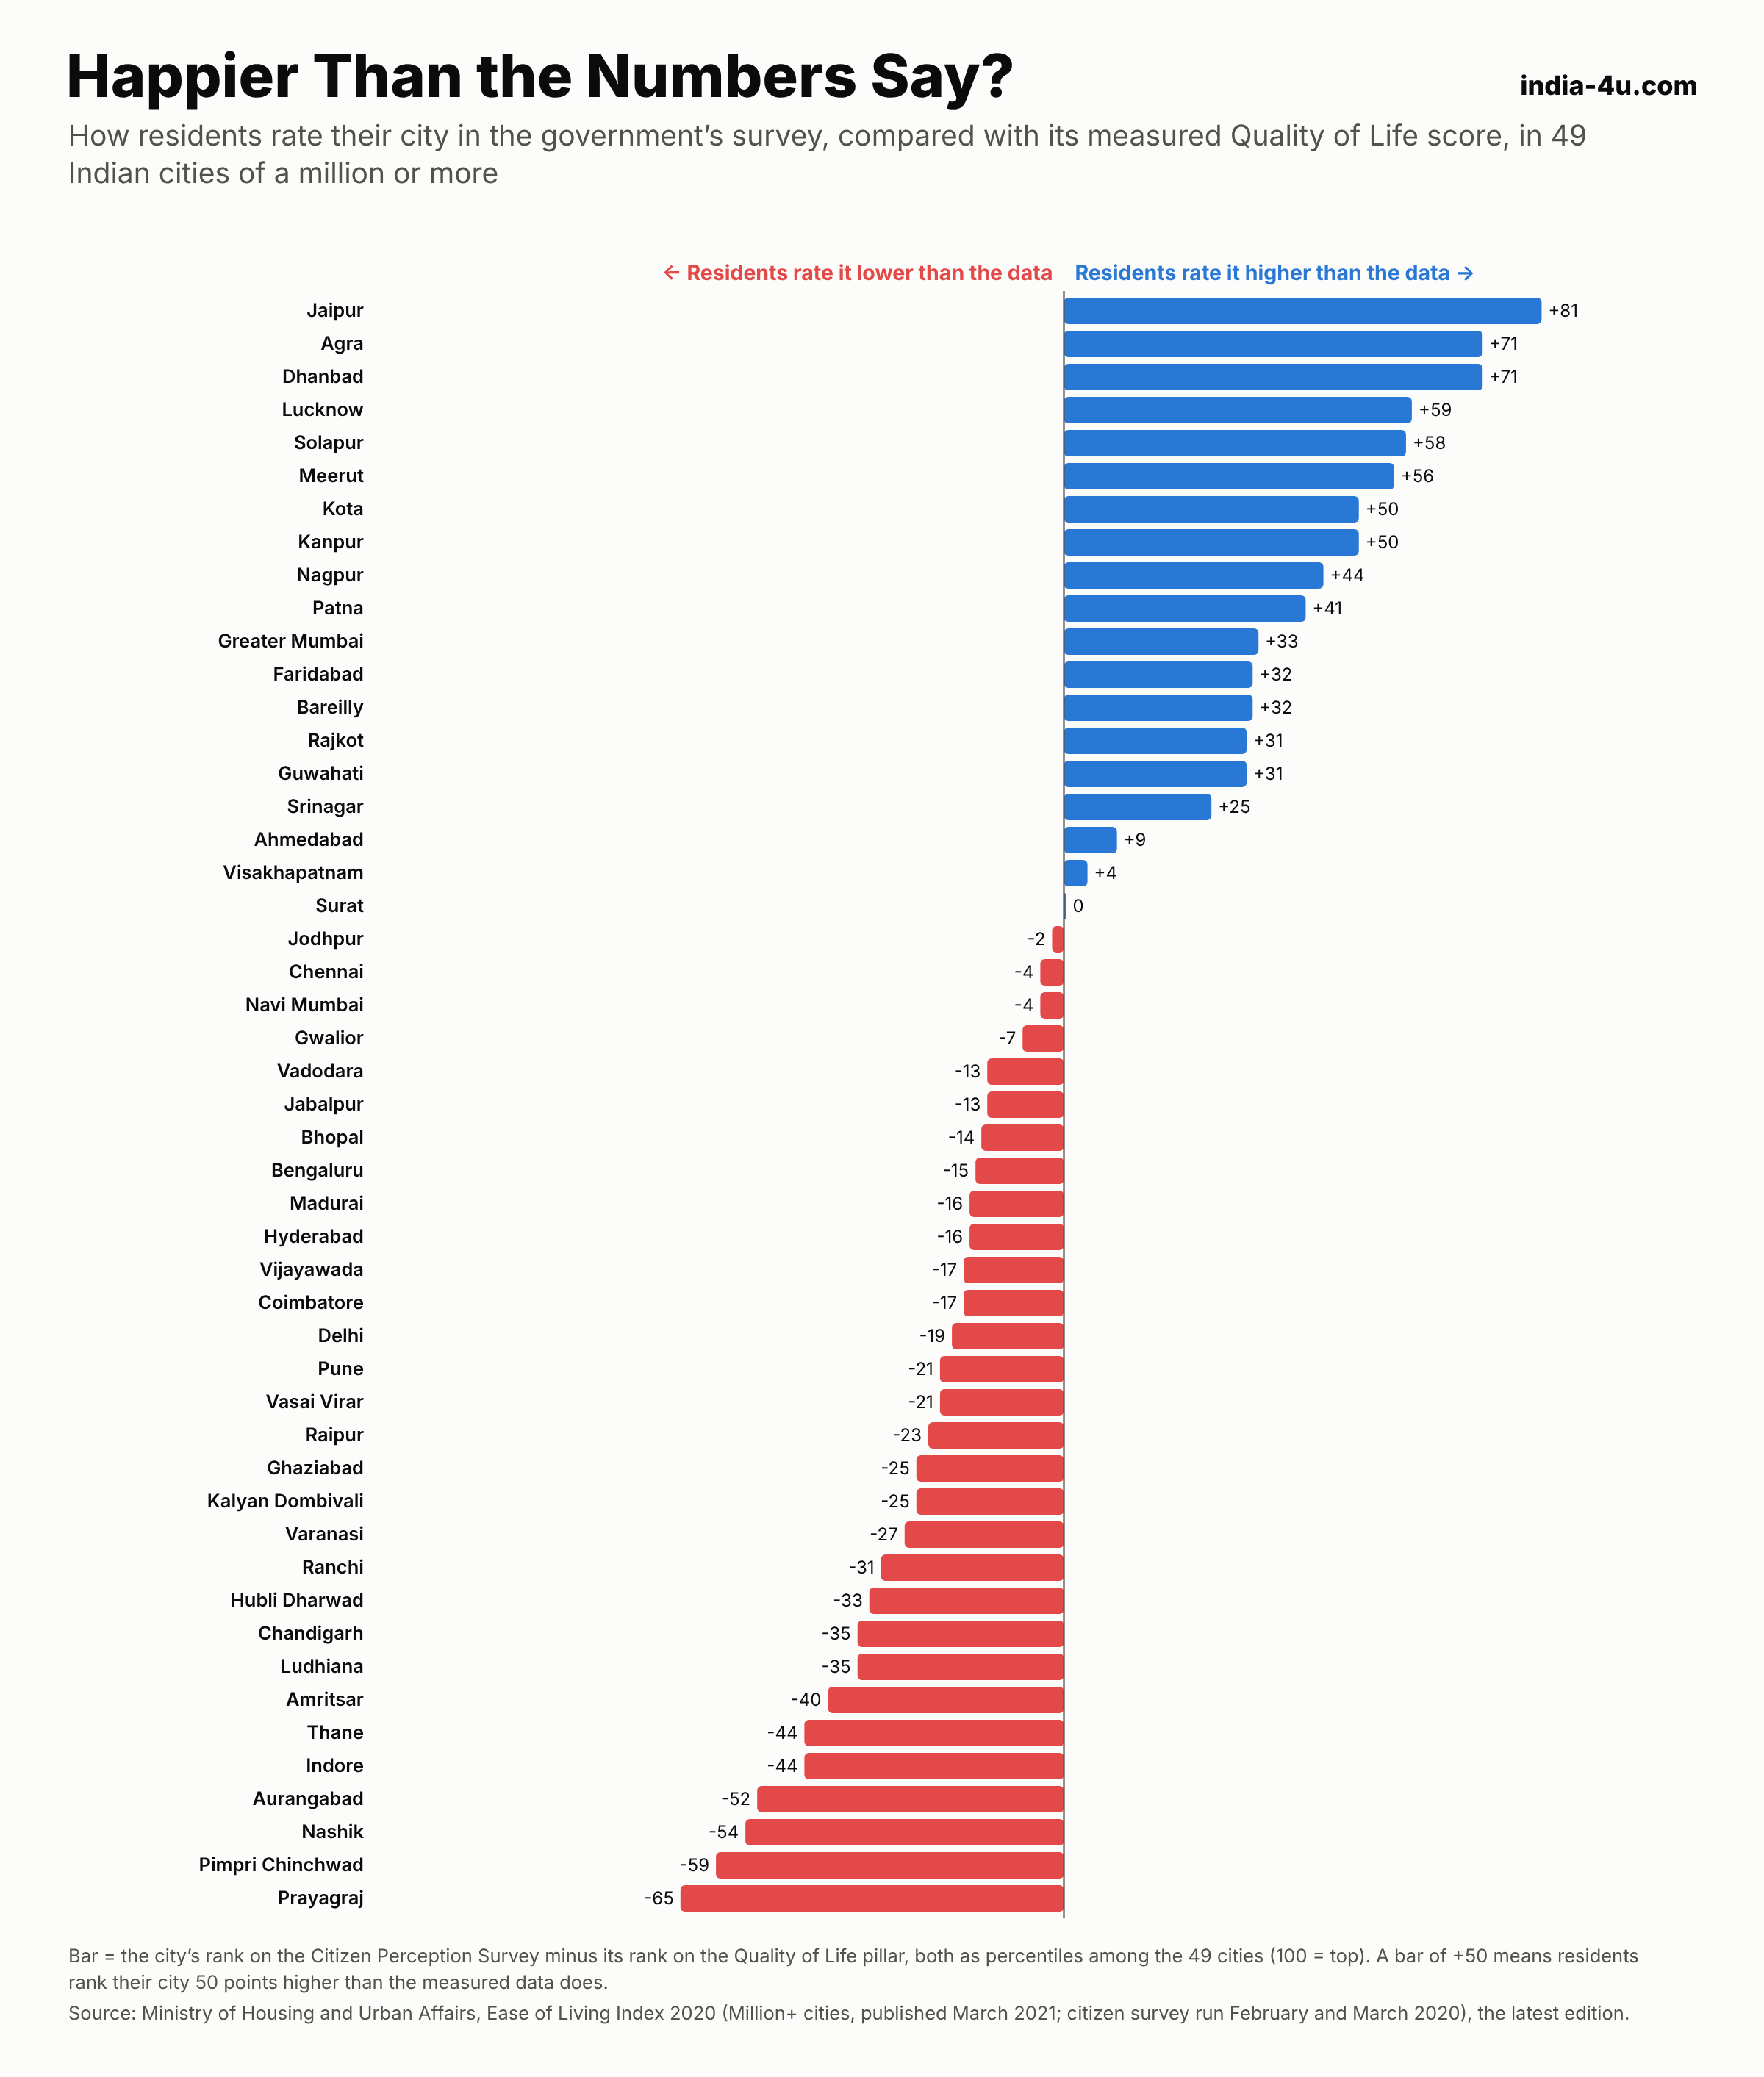
India’s Ease of Living Index measures each big city’s living conditions and also asks residents what they think. We put the two side by side to see where people love, or doubt, their city more than the data suggests.
The short answer
Jaipur is where residents are most positive compared with the data: it ranks near the top of the citizen survey (87.1) but in the lower half on measured Quality of Life (47.66). Agra, Dhanbad and Lucknow show the same pattern. At the other end, Prayagraj, Pimpri Chinchwad and Nashik score well on measured living conditions, but their residents rate them far lower than other cities’ residents rate theirs.
The gap does not say either number is wrong. Official scores count things like schools, hospitals, water supply and transport; residents judge their city against their own expectations. Big, well-known cities such as Bengaluru, Delhi and Pune land slightly on the negative side.
All 49 cities
Click a column to sort.
| City | Citizen survey score | Quality of Life score | Survey rank (percentile) | Quality of Life rank (percentile) | Gap |
|---|---|---|---|---|---|
| Jaipur | 87.1 | 47.66 | 98 | 17 | +81 |
| Agra | 80.3 | 45.72 | 81 | 10 | +71 |
| Dhanbad | 78.9 | 34.71 | 73 | 2 | +71 |
| Lucknow | 82.4 | 51.30 | 92 | 33 | +59 |
| Solapur | 88.8 | 51.79 | 100 | 42 | +58 |
| Meerut | 79.3 | 48.98 | 75 | 19 | +56 |
| Kota | 78.0 | 46.42 | 62 | 12 | +50 |
| Kanpur | 81.2 | 51.33 | 85 | 35 | +50 |
| Nagpur | 78.1 | 50.59 | 67 | 23 | +44 |
| Patna | 77.5 | 47.02 | 56 | 15 | +41 |
| Greater Mumbai | 77.9 | 51.12 | 60 | 27 | +33 |
| Faridabad | 75.2 | 45.57 | 40 | 8 | +32 |
| Bareilly | 74.4 | 45.48 | 38 | 6 | +32 |
| Rajkot | 79.5 | 51.86 | 77 | 46 | +31 |
| Guwahati | 74.3 | 43.65 | 35 | 4 | +31 |
| Srinagar | 72.8 | 26.06 | 25 | 0 | +25 |
| Ahmedabad | 82.3 | 57.46 | 90 | 81 | +9 |
| Visakhapatnam | 77.2 | 51.93 | 54 | 50 | +4 |
| Surat | 81.4 | 57.96 | 88 | 88 | 0 |
| Jodhpur | 76.9 | 52.99 | 52 | 54 | -2 |
| Chennai | 82.6 | 60.84 | 96 | 100 | -4 |
| Navi Mumbai | 82.4 | 59.93 | 92 | 96 | -4 |
| Gwalior | 73.3 | 51.43 | 31 | 38 | -7 |
| Vadodara | 79.5 | 58.10 | 77 | 90 | -13 |
| Jabalpur | 69.5 | 50.75 | 12 | 25 | -13 |
| Bhopal | 78.5 | 57.92 | 71 | 85 | -14 |
| Bengaluru | 78.0 | 55.67 | 62 | 77 | -15 |
| Madurai | 76.4 | 54.49 | 46 | 62 | -16 |
| Hyderabad | 70.7 | 51.28 | 15 | 31 | -16 |
| Vijayawada | 67.4 | 50.40 | 4 | 21 | -17 |
| Coimbatore | 80.3 | 60.33 | 81 | 98 | -17 |
| Delhi | 69.4 | 51.22 | 10 | 29 | -19 |
| Pune | 78.2 | 58.10 | 69 | 90 | -21 |
| Vasai Virar | 72.6 | 51.84 | 23 | 44 | -21 |
| Raipur | 75.3 | 54.74 | 42 | 65 | -23 |
| Ghaziabad | 73.6 | 54.11 | 33 | 58 | -25 |
| Kalyan Dombivali | 77.6 | 57.80 | 58 | 83 | -25 |
| Varanasi | 76.4 | 55.50 | 46 | 73 | -27 |
| Ranchi | 70.7 | 51.86 | 15 | 46 | -31 |
| Hubli Dharwad | 71.0 | 52.53 | 19 | 52 | -33 |
| Chandigarh | 72.8 | 54.42 | 25 | 60 | -35 |
| Ludhiana | 75.9 | 56.00 | 44 | 79 | -35 |
| Amritsar | 61.7 | 51.50 | 0 | 40 | -40 |
| Thane | 72.8 | 55.04 | 25 | 69 | -44 |
| Indore | 76.8 | 59.86 | 50 | 94 | -44 |
| Aurangabad | 71.3 | 55.50 | 21 | 73 | -52 |
| Nashik | 64.2 | 53.29 | 2 | 56 | -54 |
| Pimpri Chinchwad | 68.2 | 54.79 | 8 | 67 | -59 |
| Prayagraj | 68.0 | 55.33 | 6 | 71 | -65 |
How we built this
Both scores come from the Ease of Living Index 2020 by the Ministry of Housing and Urban Affairs. The Citizen Perception Survey ran in February and March 2020. The Quality of Life pillar measures education, health, housing and shelter, water and sanitation, mobility, safety and security, and recreation. Because the two scores use different scales, we rank each city on both as a percentile among the 49 cities with a million or more people (100 is the top) and show the difference. This is the latest edition of the index.
See the full ranking on the best cities to live in India.
Frequently asked questions
Which Indian city do residents rate highest compared with official data?
Jaipur: residents rank it 81 percentile points higher than its measured Quality of Life score does.